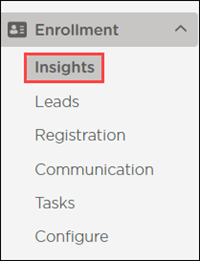
Navigation Changes
The Leads and Registration sections are now under Enrollment.
Use Insights to understand the effectiveness of converting your leads to enrolled families. There are two ways to view insights: as a Pipeline and a Funnel.
Go to Enrollment > Insights.
The Pipeline section provides a snapshot of leads by status and allows you to compare data for two dates at a time.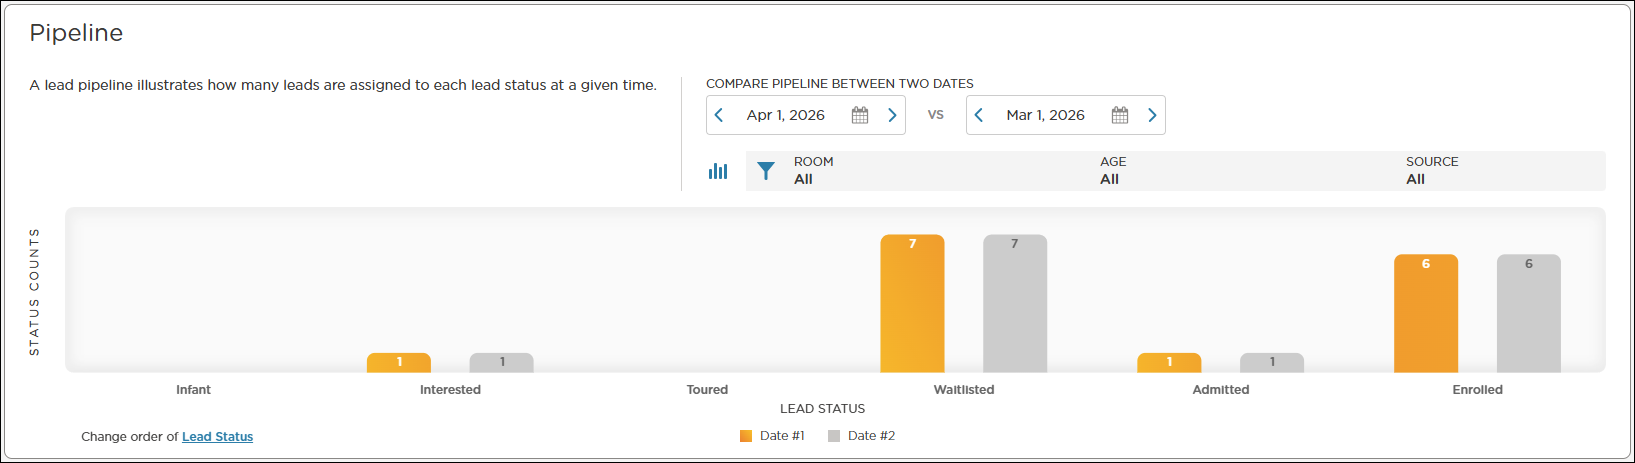
The Funnel section displays how leads move through the lead process, which includes the percentage of leads that convert from one status to the next (for example, Toured to Waitlisted) and the average time a lead spends in each status.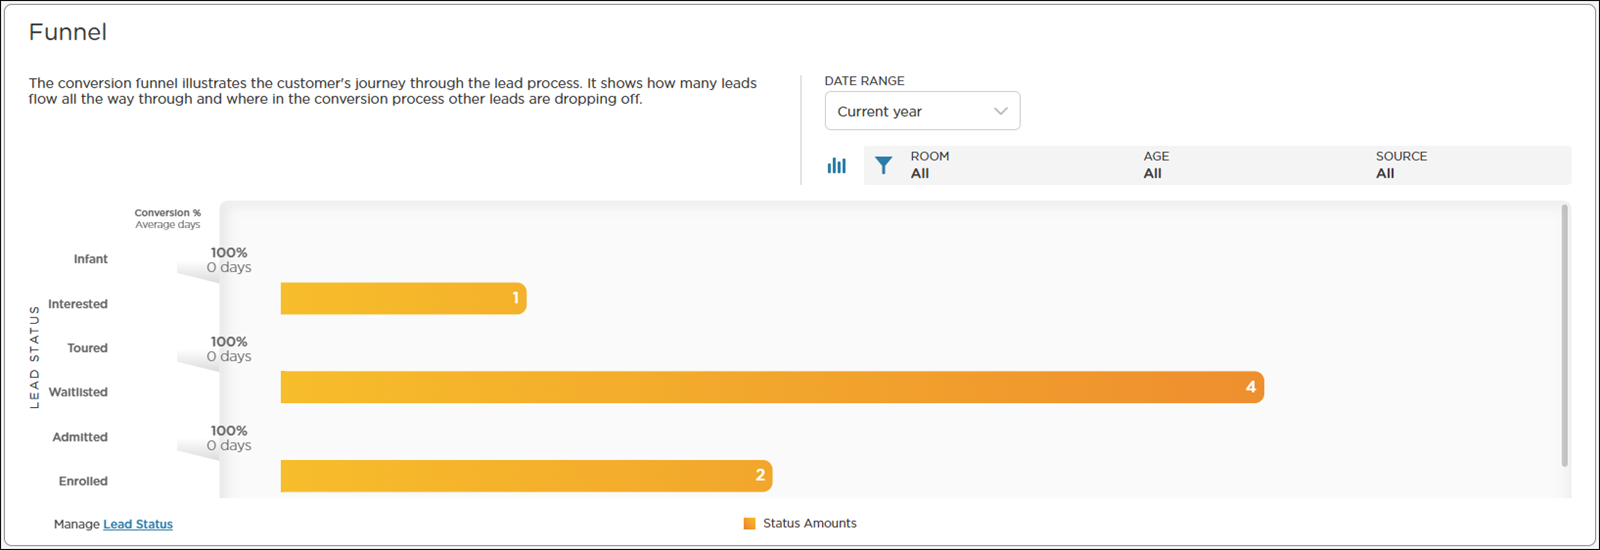
Date Range
Use the Date Range filter to choose the range of dates you want to view.
The Pipeline section allows you to select two dates to compare the data. By default, the filter displays the current date and the date 30 days prior.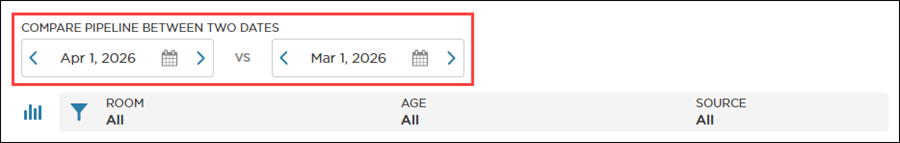
The Funnel section has the following date range options: 30 days, 3 months, 6 months, current year and custom date range.
When choosing a custom range, select a start date and end date. The date range displays in the Select Range field and the chosen dates display in blue on the calendar view.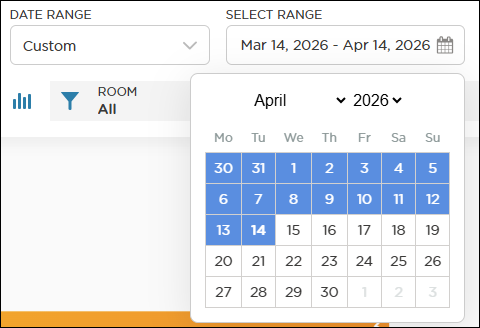
Table Filtering
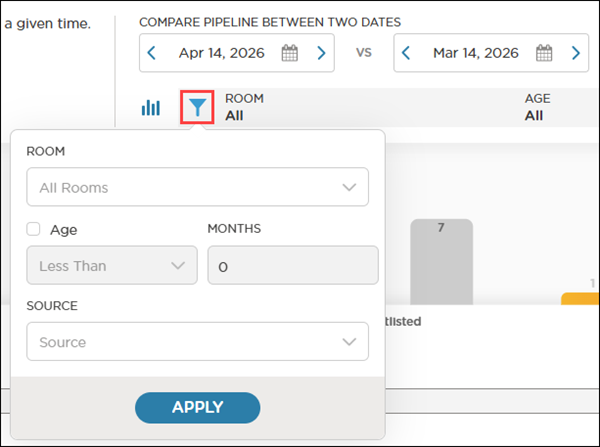
You can filter the lead data by status, room and more in each section.
Both sections have a Status Filter ![]() , which allows you to select the statuses you want to view. You can select, clear and reorder the statuses using this filter.
, which allows you to select the statuses you want to view. You can select, clear and reorder the statuses using this filter..png)
Use Filter ![]() to filter the data by room, age and source (event, internet, referral, etc.).
to filter the data by room, age and source (event, internet, referral, etc.).