Enrollment with Confidence: Master RoomRunner for AI-Powered Planning
Join our live webinar to see how RoomRunner simplifies planning with AI. Register today!
The RoomRunner dashboard gives you a real-time snapshot of your center and lets you plan up to 12 months ahead. From one place and with AI-powered suggestions to help along the way, you can:
Schedule student transitions
Track openings
Act on waitlisted families
Viewing the Future
Before diving into specific features, it helps to understand how the Date Picker works. It controls everything you see on the dashboard.
Use the Date Picker to view a snapshot of your center for any month, up to 12 months into the future. When you select a month, the dashboard recalculates:
Occupancy
Available openings
All student movements (incoming, outgoing, and transitions)
Dashboard Calculations
Dashboard calculations are based on the last day of the month, after all the move plans for that month have been completed. For example, July will show the dashboard totals for the end of July, and August will display the totals for the end of August.
What to Expect
Dashboard metrics will change as you move the date forward. This is because the dashboard reflects students aging in or out of a room's age range over time. Only future months are viewable. Scheduled student move plans are also displayed.
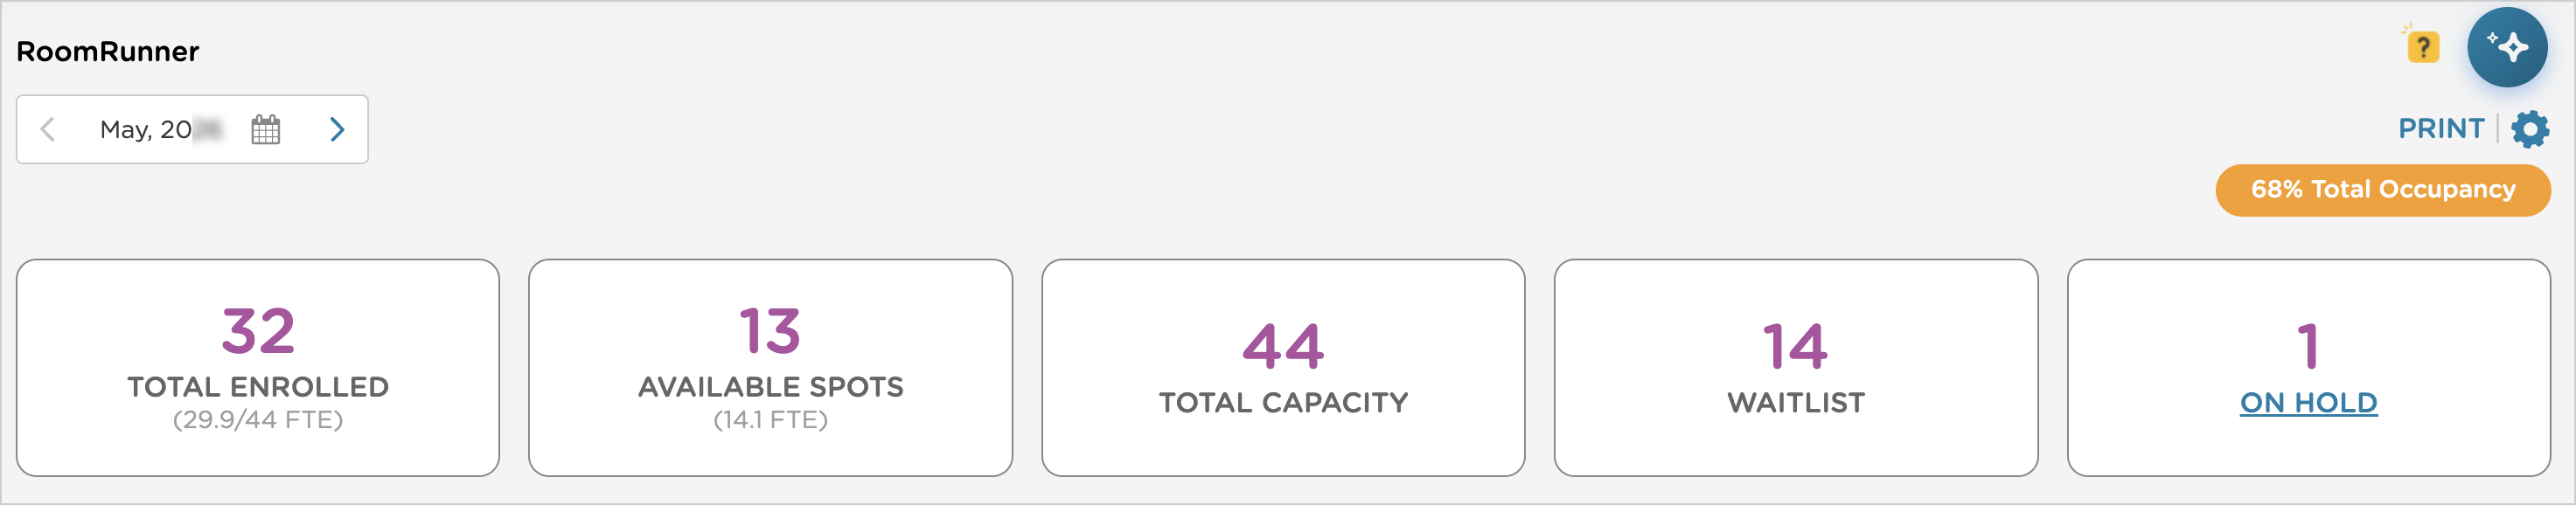
Center-Level Metrics
At the top of the dashboard, you'll see center-wide metrics for the selected month.
Here's how to read what you're seeing.
Metric | Definition | ||
|---|---|---|---|
Total Enrolled | Total enrolled student count for the month, with total full-time equivalent (FTE) usage calculated from enrolled student schedules. FTE measures enrollment in terms of full-time seats: a student attending 3 days per week, for example, counts as 0.6 of a full-time seat. | ||
Available Spots | Count of total full-time seats available, with remaining FTE capacity. The FTE available spots calculation includes part-time seats. | ||
Total Capacity | The maximum number of full-time seats your center can support across all rooms, based on each room's capacity setting.
| ||
RoomRunner Waitlist | The number of non-archived leads currently in the lead statuses selected for your RoomRunner Waitlist. This is determined by the statuses selected in Manage Lead Statuses (limit of two), and matches the age range of the rooms on the dashboard. This tile is hidden when the count is 0. | ||
On Hold | Visible only when applicable. Shows all students currently in the On Hold student enrollment status. From here, you can schedule when a student becomes Active and which room they join.
| ||
Total Occupancy | The percentage of your center's total capacity in use for the selected month. |
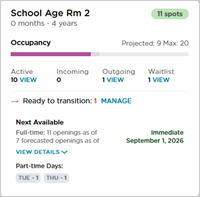
Room Card
Room Card Order
The RoomRunner Dashboard room order is determined by each room’s age range. The oldest room will be first, and the order continues downward. If two rooms have the same age range, they are ordered alphabetically.
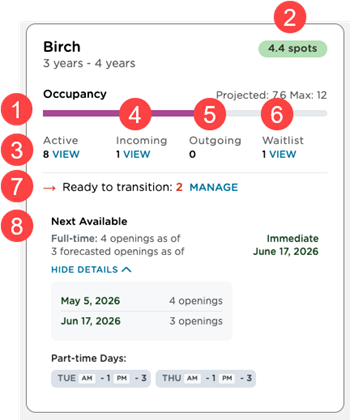
Use the numbers assigned to the definitions below to locate the field in the screenshot above.
Metric | Definition | |
|---|---|---|
| Shows how many students are enrolled at the start of the month and projects how many will be enrolled at the end of the month, after all incoming and outgoing moves. | |
|
| |
| The number of students assigned to the room as of the first day of the month selected. | |
| Students scheduled to move into the room during the month, including:
Existing move plans can be edited or canceled from this list. | |
| Students scheduled to leave the room during the month, including:
Existing move plans can be edited or canceled from this list. | |
| Leads currently in the lead statuses selected for your RoomRunner dashboard whose ages fall within the room's age range for the selected month. RoomRunner Waitlist draws from the Lead Statuses configured as your Waitlist in Manage Lead Statuses (limit of 2). This list may change month to month, as the system recalculates each student's age based on the selected month; some students may move into a different room's age range as a result. | |
| An age-based signal for students who are within 45 days of exceeding the room’s maximum age or who have already exceeded the age limit, which helps you plan age-up moves. | |
| The date when the next full-time or part-time opening appears in the room, after considering:
|
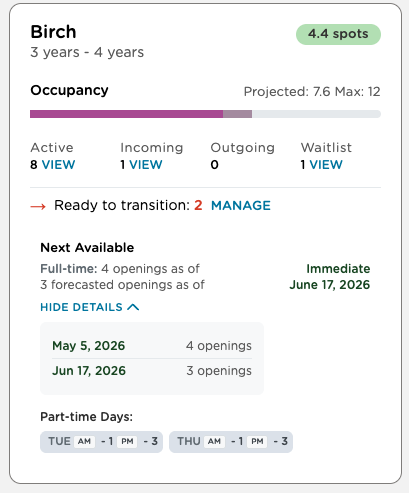
Case Study - Birch Room
Occupancy
The Birch room has a capacity of 12 students
8 students are currently enrolled (Active)
Not all enrolled students attend full‑time. Some are part‑time. The combined FTE of these students is 6.6
Incoming students are factored into projected occupancy. The 1 incoming student adds 1.0 FTE, bringing the total to 7.6
Since the room allows 12 total spots:
12 total spots − 7.6 used spots = 4.4 available spots
Current and Upcoming Openings
As of May 5, there are 4 full-time openings available
An additional 3 full-time openings are forecasted to become available by June 17
Part‑Time Availability
Part‑time attendance is available on:
Tuesday AM
Tuesday PM
Thursday AM
Thursday PM
How FTE Is Calculated | How Seat Availability Is Calculated | ||||||||
FTE (full-time equivalent) measures seat utilization, or how much of your room capacity is being used, based on enrolled schedules rather than headcount alone. RoomRunner assumes a 5-day operating week. AM and PM are counted separately — AM = 0.1 and PM = 0.1, making one full day 0.2. | The FTE values for all children in a room are added together and compared to the room's capacity.
Example: A room with a capacity of 10, three full-time students, and two students attending 3 days each: 3.0 + 0.6 + 0.6 = 4.2 FTE used, with 5.8 spots remaining. | ||||||||
|
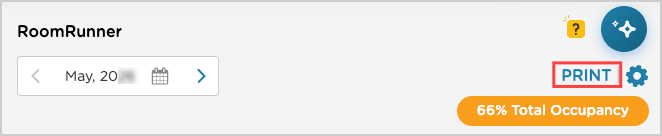
Printing the Dashboard
To share your enrollment snapshot, click the Print button on your dashboard. This will give you a clear, formatted version of what you see on your screen. There is no CSV export, what you see is what prints. If you have trouble printing, make sure your web browser is up to date or try clearing your cache.
| Troubleshooting Guide |

The most common cause of unexpected occupancy numbers is incorrect student schedules. If students who attend part-time are listed as full-time in the system, RoomRunner will show fewer available spots than you actually have. To resolve:
Go to the active students list from each Room Card on the dashboard.
Review the schedule column, and look for students whose listed schedule doesn't match reality.
Update the student profile’s schedule.
The dashboard will recalculate automatically.
Accessing the Student Profile
Clicking a student’s name in the active list takes you directly to their profile page, where any edits can be made.
FAQ for RoomRunner
Check out our FAQ article dedicated to RoomRunner questions.